
Managing Saline and Sodic Soils and Irrigation Water
Burdette Barker , USU Extension I rrigation S pecialist
Grant Cardon , USU Extension S oils S pecialist
Matt Yost , USU Extension Agroclimate Specialist
Melanie Stock , USU Extension Urban and Small Farms Sp ecialist
Earl Creech , USU Extension Agronomy Specialist
Jody Gale , USU Extension Associate Professor
Introduction
Salt is important in plant and soil management. Excessive salt concentrations in soil can cause water to be less available to plants because of the osmotic forces of salt in the soil water. Excessive concentrations of some salt ions can also be toxic to plants. In agricultural soils and irrigation water, salts are typically described in two ways:
1. Salinity, or total salt concentration, and
2. Sodicity, or the concentration of sodium relative to other cations (positively charged atoms or compounds).
Understanding the effect of both salinity and sodicity on plants and soils and the appropriate management and reclamation practices can improve crop yield and the optimal use of crop inputs.
Measures of Salinity
The most common measure of salinity in soils and water is electrical conductivity (EC). For agricultural soils, the EC of the soil extract (ECe) is typically used The soil extract is obtained by saturating a soil sample with pure water and measuring the EC of water extracted from the sample. This will typically be presented in the following units:
• Decisiemens per meter (dS/m)
• Microsiemens per centimeter (µS/cm; 1 dS/m = 1,000 µS/cm)
• Retired units of millimhos per centimeter (mmho/cm; 1 mmho/cm = 1 dS/m).
Soil salinity is classified based on EC (Table 1). Soil salinity is typically measured by collecting and sending samples to a lab. While field test meters exist, soil probes that provide EC are typically not an accurate measure of the ECe
Table 1. General Soil Salinity Classifications
Soil extract electrical conductivity (ds/m) Salinity class
0 - 2
2 - 4
4 - 6
8 - 16
> 16
Nonsaline
Very slightly saline
Crop sensitivity
Suitable for most crops
Salt-tolerant vegetables, many grains, and forages
Slightly saline Highly salt-tolerant plants
Moderately saline
Strongly saline
Not suitable for crops
Not suitable for crops
Sources: Natural Resources Conservation Service (1990) and Tables 3 and 4.
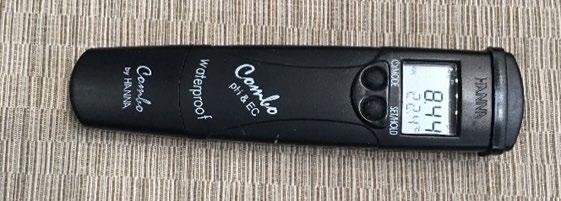
Irrigation water EC (ECw) can be measured by collecting and sending a water sample to a lab. Additionally, handheld EC probes are also available, and many can provide accurate measurements of ECw in the field (Figure 1).
Sources of Salt
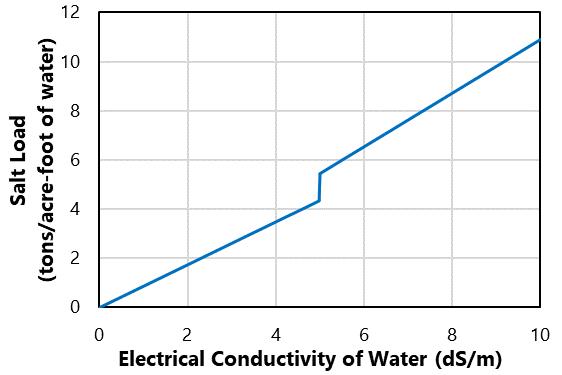
Salt may be naturally present in soil because of the local geology, mineral weathering, and climate particularly precipitation. Salt is also added to soil in through compost, manure, and fertilizer Irrigation water is often the most significant source of salt. For example, water with an ECw = 2 dS/m has about 1.7 tons of salt per acre-foot of water (Figure 2). If 30 inches of this water is applied to a field in one year, this would be about 4.4 tons of salt per acre annually! The salt content in precipitation is negligible, but soils in areas with less precipitation more readily accumulate salts.
Salinity Impacts on Crops
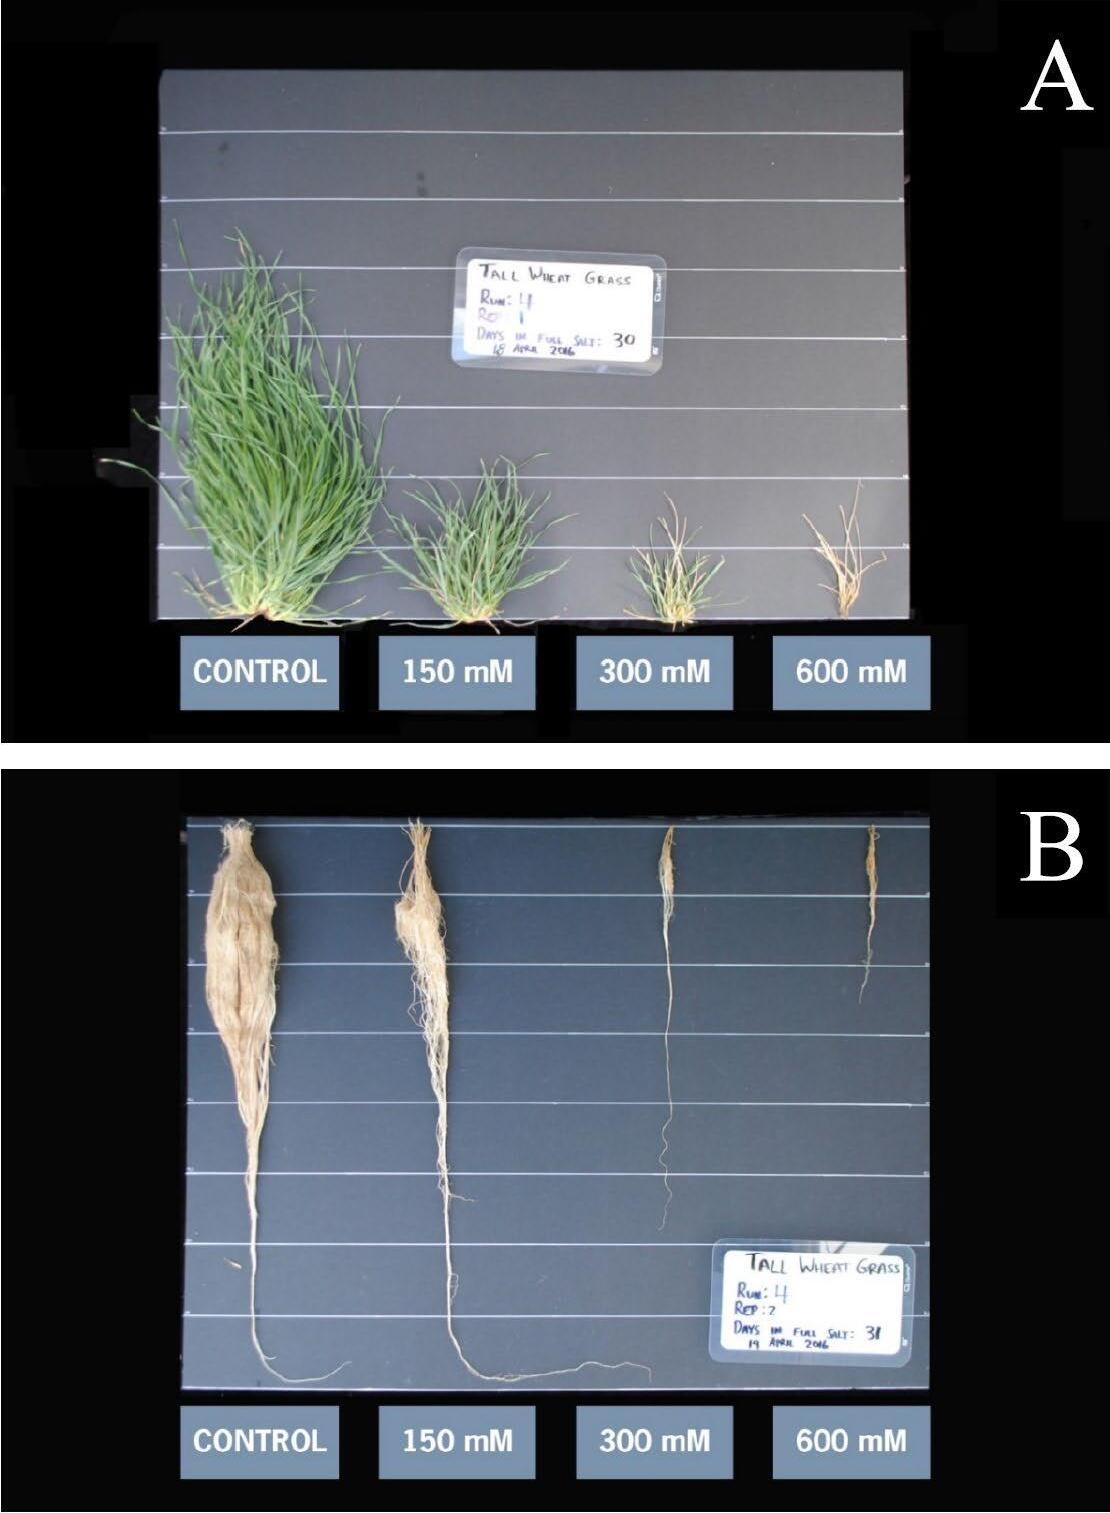
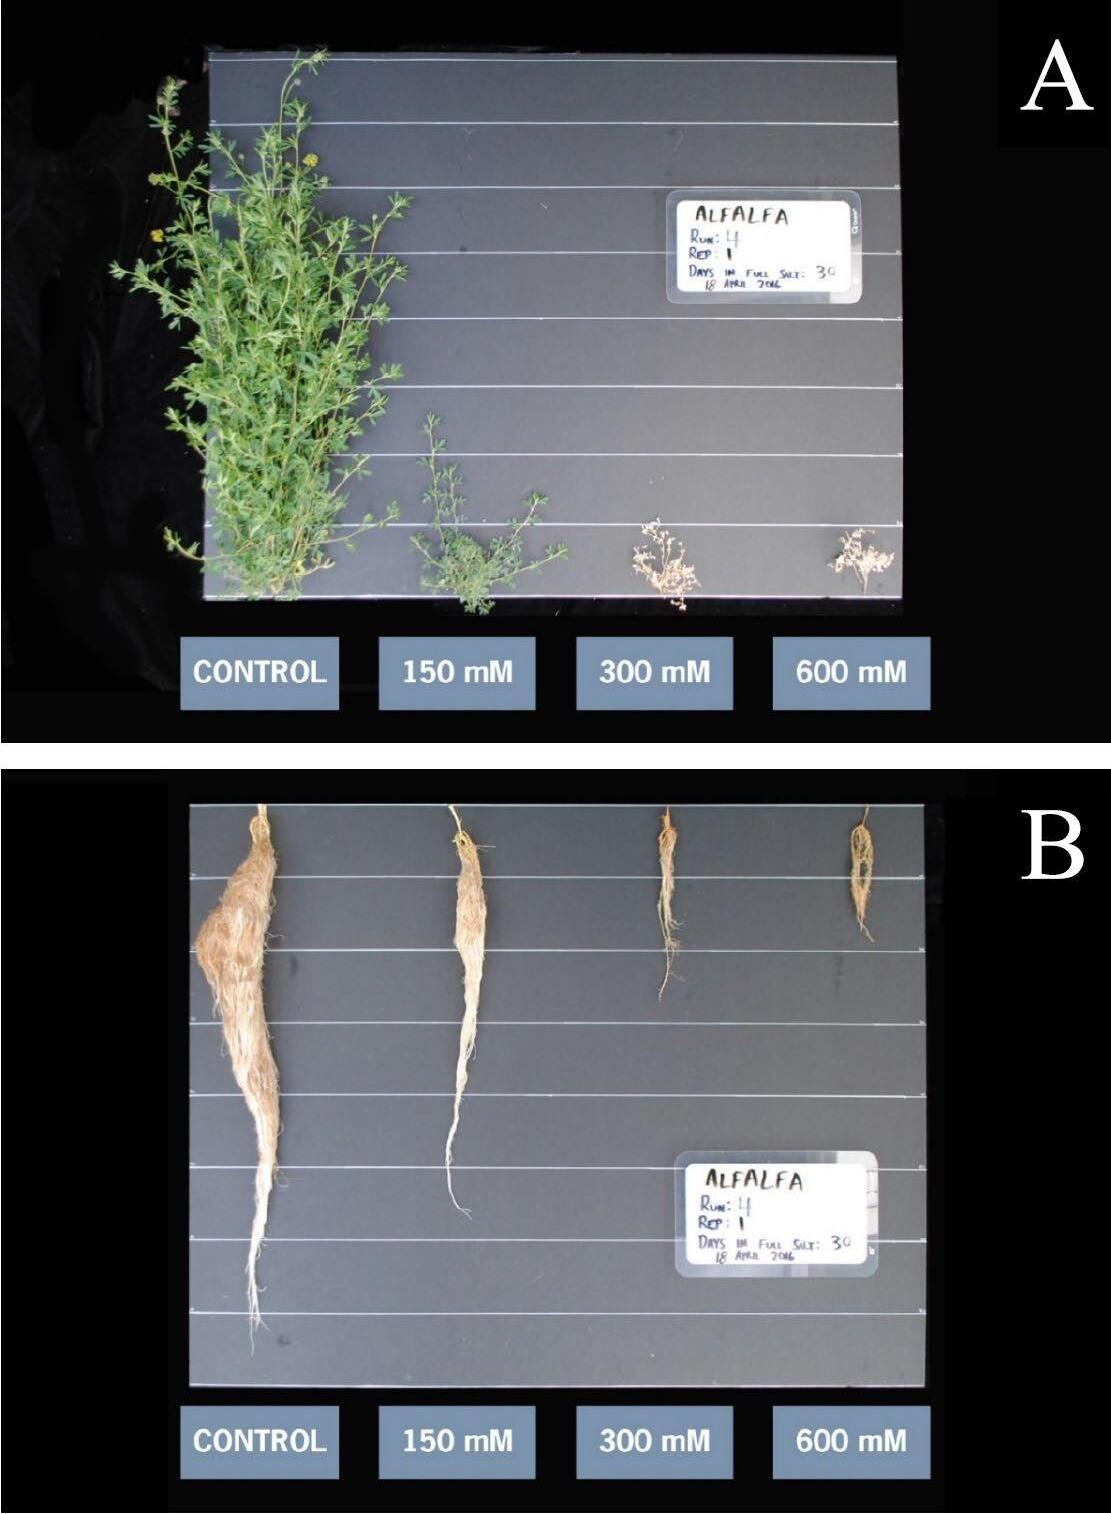
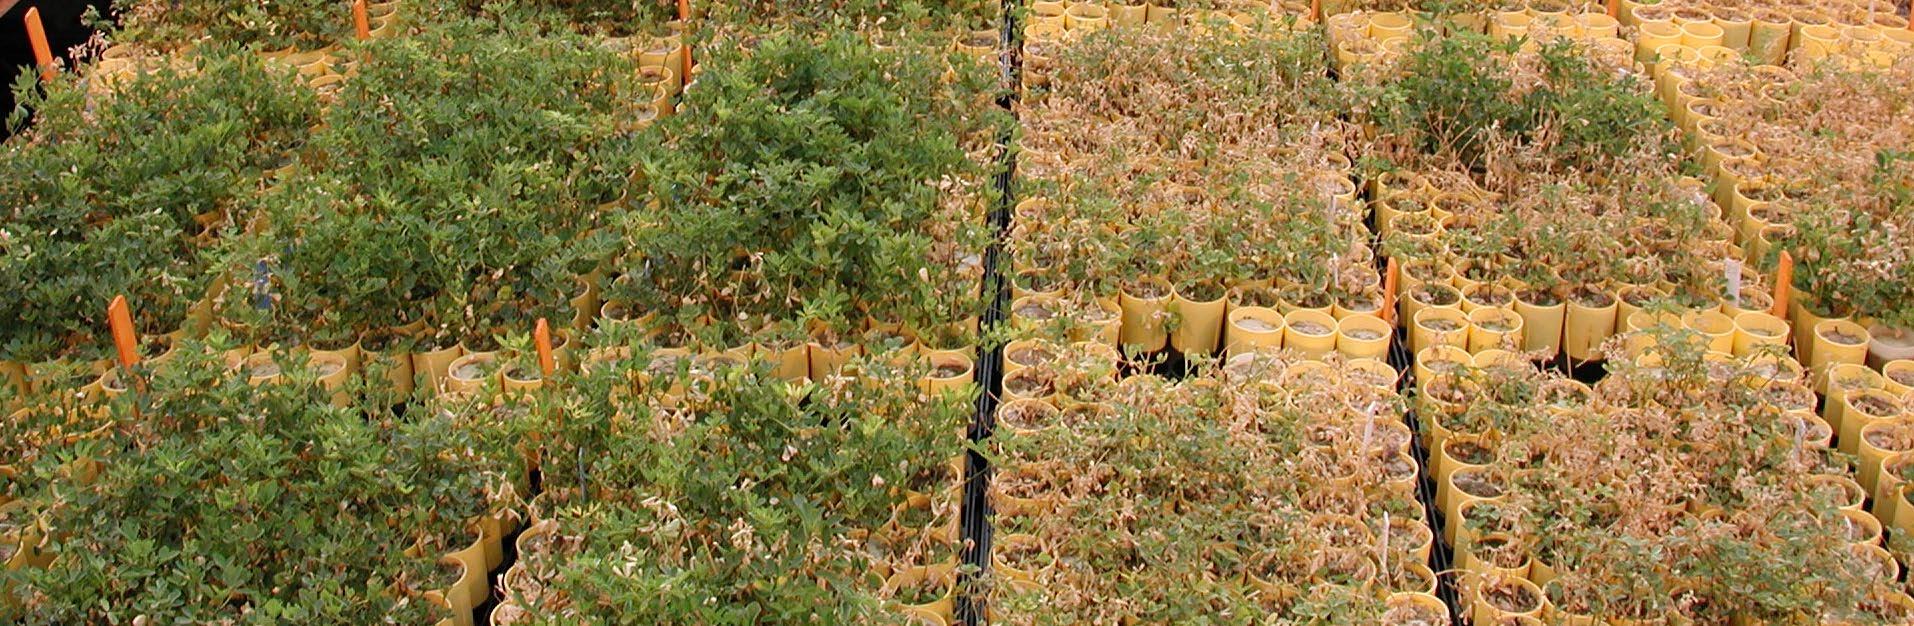
Plants extract water from the soil by concentrating solutes (ions and other molecules) inside the cells of their roots. This causes water from the soil to “want” to flow into the root through osmosis. When salt ions build up in the soil, the plant needs to concentrate even more solutes in the roots to extract water. This takes energy from the plant and can cause water stress. Therefore, symptoms of general salinity stress often look like water stress (Figures 3 and 4) These include stunted growth in the initial crop growth stages and leaf margin burn/drying. Visual symptoms of salinity are often only observed in extreme conditions. Salinity may negatively impact crop yield before such extreme conditions occur. It is, therefore, important to test for and address soil salinity before significant damage has occurred. Symptoms of toxicity to specific salt ions may differ from general salinity impacts, though often will include leaf margin burn/drying and leaf curl In addition to
soil salinity, salt ions from irrigation water can also accumulate on plant leaves and cause desiccation damage when using sprinkler irrigation (Hoffman & Shalhevet, 2007; Table 2).


Table
Feature Increasing tolerance to salt on leaves1
1Sources: Ayers and Westcot (1985). The original is for sodium and chloride ions only. Converted to dS/m following EWT Water Technology (2021) and Natural Resources Conservation Service (2018).
Salinity Impacts on Soil
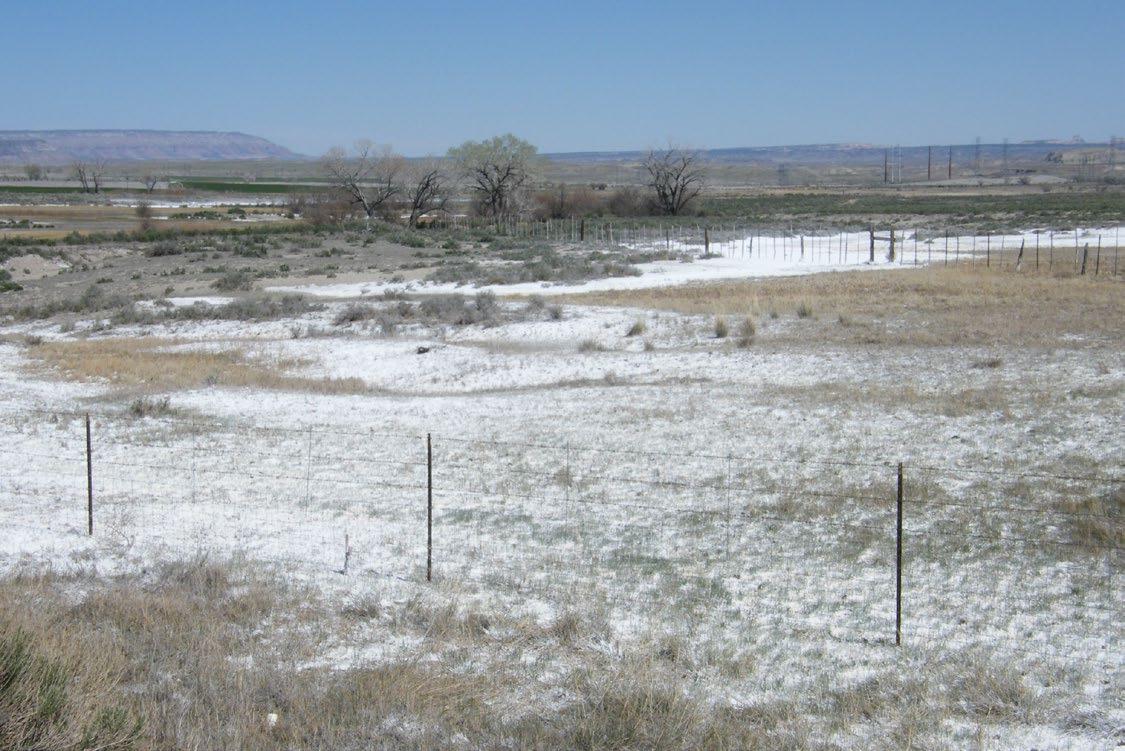
Visual evidence of salinity in soil may be difficult to observe for lower levels of soil salinity that may still cause injury or yield decline in sensitive crops. At more extreme salinity levels, white-to-creamcolored crystals or deposits may be visible on soil surfaces (Figure 5), but other salt may also have other colors, like black.
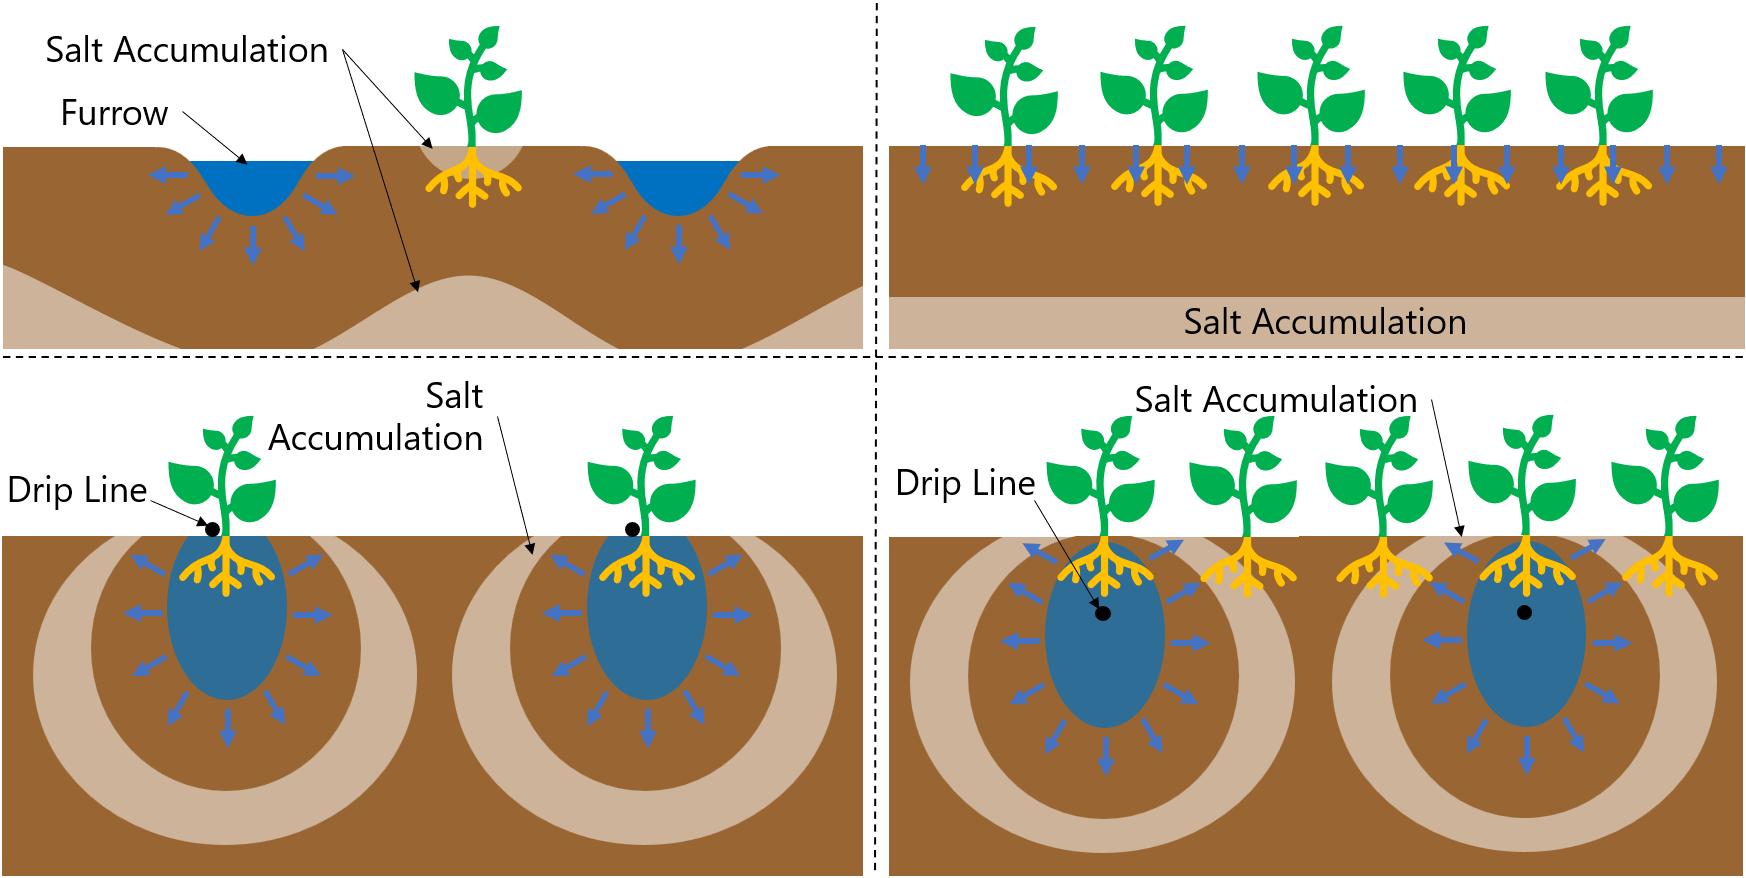
Do not wait for visual indications in the soil to begin salinity management. Salt moves with water, concentrated in the soil when water is removed through evaporation and plant transpiration (evapotranspiration). Therefore, salt generally accumulates on the edges of crop beds, furrow edges, and in surface cracks. Because salt moves with water, salt accumulation varies with the irrigation method (Figure 6):
• Furrow-irrigated fields W ater from furrows pushes salt downward but also into the center of crop beds; this can be a problem for seedlings.
• Sprinkler, border, and basin irrigation All these methods apply a relatively uniform amount of water to the soil surface, so salts generally move downward.
• Drip irrigation W ater forms bulbs of wetted soil under the drip emitters. This behavior forces salt down and out in all directions from the emitter. So, salt can accumulate at the soil surface above the crop roots. This is particularly problematic if plants are located midway between emitters and in subsurface drip irrigation.
Sodicity, the Complicating Role of Sodium
Sodicity refers to the presence of sodium in the soil. Of particular concern is the concentration of sodium (Na+), which has one positive charge (monovalent), in relation to ions that have two positive charges (divalent) like calcium (Ca++) and magnesium (Mg++).
Sodicity is of concern for soil structure and water infiltration. Clay particles are covered in negative charges. Because of this, positive ions in the soil are attracted to clay particles in a process called adsorption Divalent ions can be attracted to two adjacent clay particles at the same time; this causes those particles to clump together, or aggregate, in a process called flocculation (Figure 7). The result is aggregated soil particles that make larger pores through which water can flow. However, when monovalent ions, like sodium, are attracted to a clay particle, they are unable to be attracted to two particles; rather, they create a repelling force between layers of sodium on adjacent clay particles. This causes the clay particles to separate or disperse from one another. This dispersion creates very small pores that are difficult for water to move through.
Since the effects of sodium on soil are related to its concentration relative to divalent ions, sodicity risk is quantified using the relative concentration of sodium to calcium and magnesium (two prevalent divalent ions). This relative concentration is called the sodium adsorption ratio (SAR):
where
CNa = Concentration of sodium (mg/L)
CCa = Concentration of calcium (mg/L).
CMg = Concentration of magnesium (mg/L).
SAR is measured in both soil extracts and irrigation water. Monitor both regularly to manage sodicity effectively. Soils with a SAR > 13 are considered sodic (Garcia, 2014; Davis et al., 2003). There may be no visual evidence of sodicity. However, soils with sodicity problems will often have trouble with water infiltration; they may also have soil structure problems resulting in low loadbearing capacity.
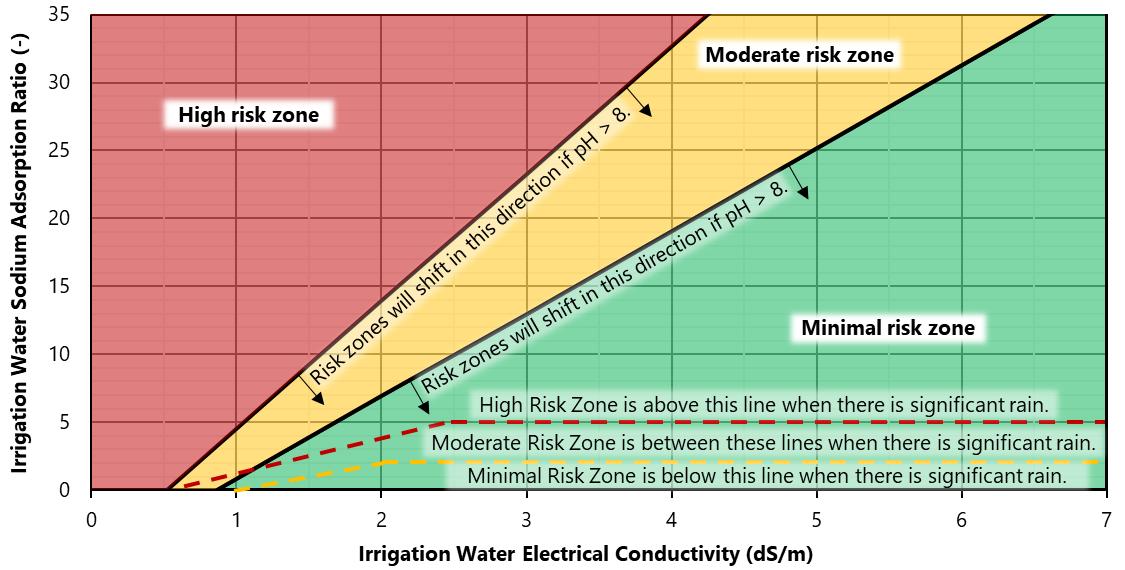
The impact of irrigation water sodium on soil water infiltration capacity depends on irrigation water ECw and pH (Figure 8). Rainfall has low ECw; therefore, it can cause soil particles to disperse at the soil surface (Suarez, 2012). When there is growing season rainfall, acceptable SAR levels decrease significantly (Figure 8).
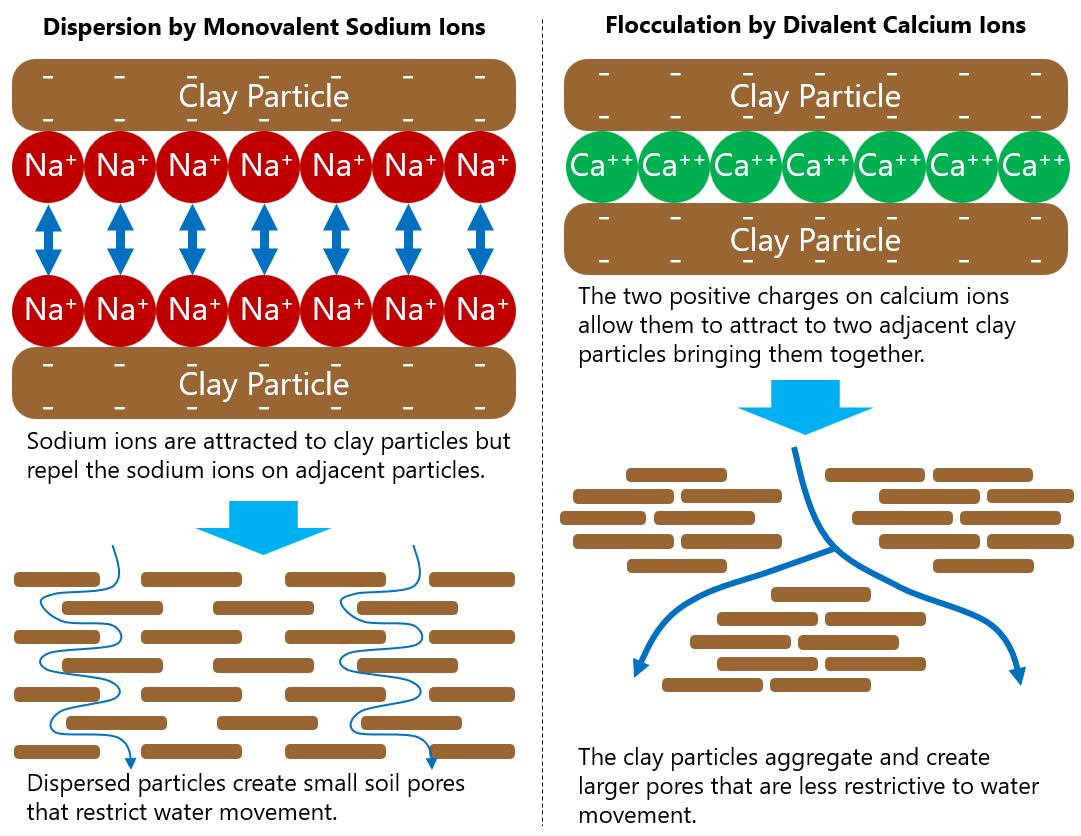
Figure 8 notes.The moderate risk zone is for infiltration reductions less than 25%, and the high infiltration risk is greater than this value. Zones are based on irrigation water pH = 8. The zone boundaries shift to the right for waters with greater pH. Rainfall can cause low EC at the soil surface; the zones shift to the dashed lines in situations with significant rainfall. Credit: The figure is based on Suarez (2012), with permission from the American Society of Civil Engineers (ASCE).This material, found at https://doi.org/10.1061/9780784411698.ch11, may be downloaded for personal use only Any other use requires prior permission from the ASCE
Salinity Management in Soil
The only effective means of removing salt from the soil is through leaching. Leaching is applying additional irrigation water beyond crop water requirements to intentionally induce water drainage below the crop’s root zone. The drained water carries some of the salt ions in the root zone with it. In fields with high water tables or soil layers that cause poor drainage, adequate leaching may require subsurface drainage (like drain tiles) to convey the drain water and salt out of the crop root zone. Precipitation, particularly in the off-season, can also contribute to salt leaching.
Leaching can take two forms:
1. Operational leaching This is frequent leaching, for example, every irrigation season or every irrigation event. This is done to avoid harmful salinity accumulation from occurring.
2. Reclamation leaching This is used to remediate soils that already have undesirable salinity levels.
Operational Leaching Requirements
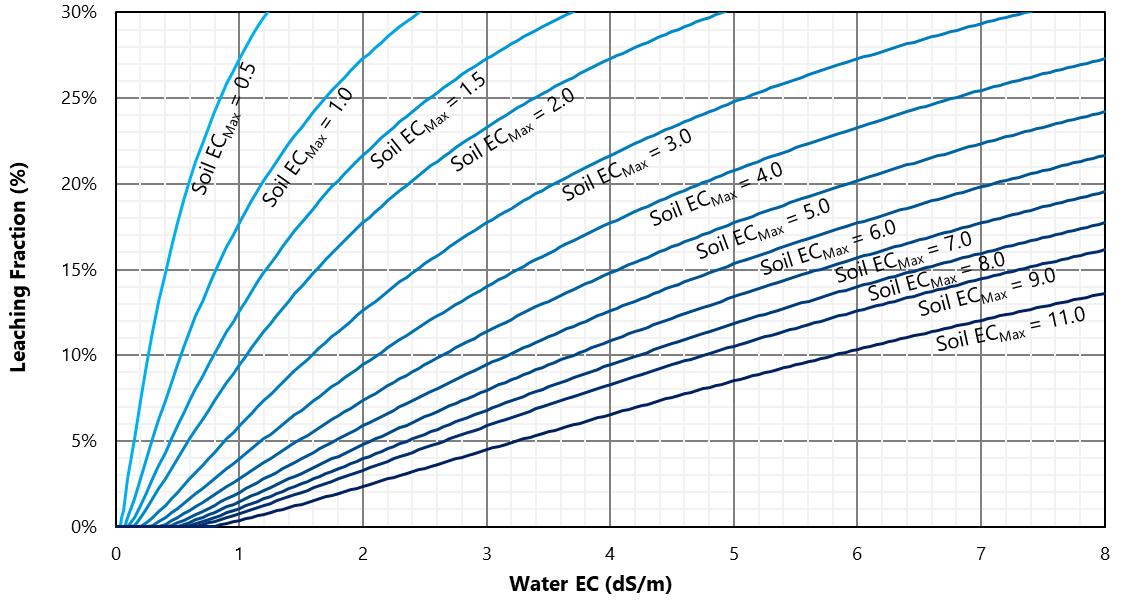
Operational leaching requirements are computed as a fraction of the total net applied irrigation water requirement (excluding irrigation application inefficiencies). This fraction is called the leaching fraction (LF) The LF is estimated based on the salinity tolerance of the crop grown and irrigation water ECw. Allowable maximum soil ECe values (ECMax) are determined through research experiments, and many such values have been published (see the Plant Tolerance to Soil Salinity section). In this guide, the Hoffmann and van Genucthen (1983) model is used to compute LF (Figure 9). Figure 9 is only accurate for locations where infiltrated precipitation is 20% or less of crop ET (common in most of Utah). If ECw is three or more times ECMax, LF exceeds 30%, and the water is unsuitable for the specified crop.
The leaching fraction is applied as:
where
Inet app = Net applied irrigation water (inches)
ET = Crop evapotranspiration (inches).
Pinfiltrated = Infiltrated precipitation (inches), 100% of small rainfalls, 80% or less of large rainfalls (see Hill et al., 2011)
LF = Leaching fraction (%)
As the LF increases, the required net applied irrigation also increases. The gross irrigation application (supplied to the turnout gate or sprinkler system) is computed by dividing the net applied irrigation by the system’s application efficiency.
������������������������ ������������ = ���������������� ������������
where
Igross app = Gross applied irrigation water (inches)
Inet app = Net applied irrigation water (inches)
Eapp = Irrigation application efficiency (%)
Example
• If seasonal ET = 25 inches, with Pinfiltrated = 4 inches and LF = 10%, then Inet app = (25 inches – 4 inches) ÷ (1 – 10% ÷ 100) = 21 inches ÷ 0.9 = 23.3 inches.
• The irrigation system is a center pivot with an assumed Eapp = 80%.
So, the Igross app = 23.3 inches ÷ 0.80 = 29 inches per year. This is the total depth of water that must be supplied to the field annually.
• If, however, the LF is 25% instead of 10%, but all other values are the same, then Inet app = (25 inches – 4 inches) ÷ (1 – 25% ÷ 100) = 21 inches ÷ 0.75 = 28.0 inches. And Igross app = 28.0 inches ÷ 0.80 = 35 inches per year. Igross app is over 20% more than when the LF was 10%.
A challenge with operational leaching is that it can be difficult to know what values should be used for ET and Pinfiltrated. One resource for an approximate starting point is Appendix I of the Utah Crop Water Use Report by Hill and others (2011; https://extension.usu.edu/irrigation/crop-water-use). In that appendix, the “Net Irr” values are the same as ET – Pinfiltrated above. Because of the challenge of knowing ET and Pinfiltrated, operational leaching requires regular soil salinity testing and subsequent irrigation management adjustments.
The LF can be applied directly in irrigation management if using an evapotranspiration-based irrigation scheduling method, such as Irrigation Scheduler Mobile (http://weather.wsu.edu/ism/). However, it can be difficult to apply this method with precision in practical irrigation management. Regular soil ECe testing is necessary to ensure optimal salinity management.
Some of the leaching requirements may be satisfied by irrigation application inefficiencies. This is observed when irrigation application exceeds crop water requirements so long as the entire irrigation application is quite uniform. This sometimes occurs in surface irrigation. If someone in this situation were to switch to using a center pivot, over-irrigation may be more difficult, and leaching must be more intentional and may be limited to early and late in the growing season.
In addition to the information in Figure, a general rule is that leaching requirements are small if irrigation water EC does not exceed the ECMax for the crop of interest (Letey et al., 2011). The LF values in Figure are for surface and sprinkler irrigation methods. Drip irrigation concentrates water application in only a portion of the soil and is therefore more effective overall in leaching (Letey et al., 2011). That said, drip irrigation concentrates salt above and to the sides of the crop roots (Figure 6). When significant rainfall events occur during the growing season, this salt can be forced into the root zone. To avoid this, it may be necessary to irrigate during rainstorms (D. Allred, personal communication, May 2023).
Reclamation Leaching Requirements
It is sometimes necessary to reclaim soil that has accumulated salt; for example, if a springtime soil test indicates salinity above the ECMax for the crop to be grown. Soils can be reclaimed by applying sufficient water to leach salt below a desired depth in the soil. For deep-rooted crops, this depth is often less than the full potential root zone because reclamation leaching requirements can become infeasibly large. Reclamation leaching can be done through ponding (a large surface irrigation application). However, for finer textured soils, less water is needed if water is ponded intermittently (multiple smaller, 2-inch to 6-inch ponding events) or if sprinkler irrigation is used for the reclamation process (Keren & Miyamoto, 2012) The ponding depth or net sprinkler application depth required to reclaim soil can be estimated as (Keren & Miyamoto, 2012):
Heavier soils under ponding (clay loams and finer):
Lighter soils under ponding and any soils for intermittent ponding or sprinklers:
where
Ireclaim = Net depth of water to apply for reclamation (inches)
ECe_initial = Initial electrical conductivity of the soil extract (dS/m).
D = Depth of soil to be reclaimed (feet).
ECe_desired = Desired electrical conductivity of the soil extract (dS/m).
Example
• A producer wants to reclaim the top 2 feet of soil in a field with clay loam soil on which alfalfa will be grown.
• The soil ECe is 6 dS/m from a lab test. Alfalfa has an ECMax of 2 dS/m.
• If using a single ponding event, the producer must apply 0.3 × 6 dS/m × 2 feet ÷ 2 dS/m = 1.8 feet, or about 22 inches of water.
• If the producer uses sprinklers or intermittent ponding events to reclaim the soil, then the total application is 0.1 × 6 dS/m × 2 feet ÷ 2 dS/m = 0.6 feet, or about 7 inches of water one-third the amount!
The soil salinity should be retested after a reclamation event to ensure successful reclamation. Some reclamation efforts require several irrigation events. In such cases, it is helpful to grow a salt-tolerant crop while reclaiming the soil. One of the most suitable crops for this purpose is barley, which is among the most salttolerant crops. Other highly salt-tolerant crops can also be used (see Plant Tolerance section).
If the soil is sodic (SAR > 13) or the irrigation water SAR is estimated to have an impact on infiltration (Figure 7), then soil amendments may be necessary to facilitate the leaching (Keren & Miyamoto, 2012; see Sodicity Management in Soil section).
Prevention
The most effective salinity management strategy is preventing salt accumulation by not using saline waters to irrigate. There is sometimes a desire to mix saline water with low-salt water to dilute the salt. However, the net useable (not salty) water is effectively the same with and without mixing.
Growing Salt-Tolerant Crops
Different crops have different tolerances to soil salinity. Therefore, one salinity management option is to grow crops that are more salt tolerant. Such crops have a smaller leaching requirement for a given ECw without significant impacts to yield. Small grains like barley (Figure 10) and wheat are much more salt tolerant than most vegetable and fruit crops (see Plant Tolerance section).
Salt Neutralizing Products
Some products are marketed as having the ability to “neutralize” salts. These products are typically large organic compounds to which ions (salts) can adsorb (attach because of ion charge). Thus, these products can tie up salt for a while. Eventually, these large compounds break down and release the salt ions back into the soil water. Using chemical products to reduce salinity is not recommended. Leaching is the only effective means of removing salt from the plant’s root zone.
Water- and Ion-Treating Devices
Some devices are marketed to change the properties of water or ions using magnets. The impacts of salinity and sodicity on soil and plant growth are related to ion concentrations. These products do not reduce the number of ions in the water and, therefore, will not decrease the risk of salt or sodium accumulation in the soil.
Sodicity Management in Soil
Leaching alone is not an effective reclamation practice in sodic soils because sodium reduces soil infiltration capacity. Sodic soils are reclaimed using a combination of leaching and soil amendments that add divalent ions (those with two positive charges), like calcium. Please note that adding such amendments will increase the soil’s total salinity (EC), meaning that additional leaching will likely be required Because of this and other effects of altering soil chemistry, adding more soil amendments than necessary should be avoided. The most common amendment for reclaiming sodic soil is gypsum. Gypsum is also the recommended amendment for Utah’s calcareous soils (soils with an abundance of calcium). The gypsum requirement (Keren & Miyamoto, 2012) can be computed as:
�������� = ���� × �������� × ������������ × (���������������������������������������� ���������������������������������������� ) 85.4
where
GR = Required gypsum application (tons/acre).
D = Depth of soil to be reclaimed (feet)
BD = Average soil bulk density of the soil depth to be reclaimed (grams/cubic centimeter)
CEC = Average cation exchange capacity of the soil depth to be reclaimed (milliequivalents/100 grams)
SARinitial = Initial sodium adsorption ratio in the soil depth to be reclaimed
SARdesired = Desired sodium adsorption ratio in the soil
The SAR and CEC should be obtained from a lab soil analysis. The bulk density can be measured by carefully sampling a known soil volume and then drying and weighing the soil, but reasonable estimates can be obtained from the Natural Resources Conservation Service soil surveys (https://websoilsurvey.sc.egov.usda.gov).
In calcareous soils, acidifying amendments can be added to free up that calcium. However, these amendments are typically less effective than gypsum at producing free calcium ions and typically have more localized (less uniform) effects. One common acidifying amendment is elemental sulfur. The elemental sulfur requirement (SR) (O’Geen, 2015) can be computed as:
�������� =0.19 × ��������
In drip irrigation systems, it is possible to inject an acid (like sulfuric acid) into the irrigation system in place of elemental sulfur to lower the soil’s pH and free up calcium. This has the added benefit that sulfuric acid and other acids are often injected into drip systems for other purposes. The sulfuric acid requirement (AR) (O’Geen, 2015) is:
�������� =0 61 × ��������
Again, acidifying agents are typically not as effective as gypsum in producing free calcium.
Example
• A producer wants to reduce the SAR in the top 2 feet of soil in a field from 14 to 8. The bulk density is 1.4 g/cm3, and the CEC is 10 meq/100-g.
• If the producer uses gypsum, the gypsum requirement, GR = 2 feet × 1.4 g/cm3 × 10 meq/100-g × (14 – 8) ÷ 85.4 = 2 × 1.4 × 10 × 6 ÷ 85.4 = 1.97 tons of gypsum per acre.
• If the producer uses elemental sulfur instead of gypsum, the sulfur requirement, SR = 0.19 × 1.97 tons of gypsum per acre = 0.37 tons of elemental sulfur per acre.
• If the producer uses sulfuric acid instead of gypsum, the acid requirement, AR = 0.61 × 1.97 tons of gypsum per acre = 1.20 tons of sulfuric acid per acre. The AR does not include the weight of water in aqueous sulfuric acid.
Magnesium is also a divalent ion and is included in SAR, so one may think that magnesium-containing products could be used to manage sodicity. However, calcium is the preferred ion for sodicity reclamation because calcium is much more effective than magnesium at clay particle flocculation.
Plant Tolerance to Soil Salinity
Determining leaching requirements and selecting salt-tolerant crops requires information about the salt sensitivity of different crops. Lists of salinity tolerance are widely available; for example, Ayers and Westcot (1985) and Grieve et al. (2012) present widely used tables. These lists often classify salt sensitivity, and a maximum ECe for a plant before yield is impacted. Often, other values of ECe are presented that are associated with certain allowed yield reductions (for example, a 10% yield reduction; see Tables 3 and 4).
Sources: Grieve et al. (2012); Hoffman & Shalhevet (2007); California Fertilizer Association (1998); Sonneveld et al. (1999)
Note. Shading indicates relative salt tolerance (lighter = more sensitive, darker = less sensitive).
Sources: Grieve and others (2012); Hoffman & Shalhevet (2007)
Notes. Shading indicates relative salt tolerance (lighter = more sensitive, darker = less sensitive).
*Approximated range from sensitivity group; using the lower end of the range is recommended.
Conclusion
To effectively manage soil salinity and sodicity, it is important to know the EC and SAR of both the soil and the irrigation water. It is also important to know the grown crop’s salt tolerance. Salinity and sodicity problems are best avoided by using high-quality water for irrigation. Leaching is the only effective means of reducing soil salinity. Soil sodicity requires chemical amendments to balance out sodium concentrations in addition to leaching Care should be taken to not over-amend the soil, which can have negative effects, including increasing the soil’s EC. A small investment in regularly sampling and testing soil for ECe and SAR can help prevent severe damage to soils and crops.
Acknowledgments
This guide is an update of three previous fact sheets: Sodic Soils are Occurring More Frequently in Utah. How Should They Be Managed? by D. W. James (2010); Salinity and Plant Tolerance by J. Kotuby-Amacher, R. Koening, and B. Kitchen (2000); and Water Salinity and Crop Yield by R. Hill and R. T. Koenig (2009) Our thanks for the anonymous reviewers’ inputs on this guide.
References
Ayars, J. Hoffman, G. J., & Corwin, D. I. (2012). Chapter 12: Leaching and rootzone salinity control. In W. W. Wallender & K. K. Tanji, (Eds.), Agricultural salinity assessment and management, ASCE manuals and reports on engineering practice (No. 71, 2nd ed.). American Society of Civil Engineers
Ayers, R. S. & Westcot, D. W. (1985). Water quality for agriculture. Irrigation and Drainage [Paper No. 29, Rev. 1]. United Nations Food and Agricultural Organization, Rome. https://www.fao.org/3/t0234e/t0234e.pdf
California Fertilizer Association. (1998) Western fertilizer handbook. Interstate Publishers, Inc.
Davis, J. G., Waskom, R. M., & Bauder, T. A. (2003). Managing sodic soils [Fact sheet No. 0.504]. Colorado State University Extension https://extension.colostate.edu/topic-areas/agriculture/managing-sodicsoils-0-504/
EWT Water Technology. (2021). Concentration quantities and unit conversion in water chemistry. http://www.ewt-wasser.de/en/knowledge/concentration-quantities-unit-conversions.html
Garcia, R. (2014) New Mexico integrated cropping systems and water management handbook [AGRO-76] U.S. Department of Agriculture Natural Resources Conservation Service.
https://www.nrcs.usda.gov/wps/portal/nrcs/detail/nm/technical/?cid=nrcs144p2_068965
Grieve, C. M., Grattan, S. R., & Maas, E. V. (2012). Chapter 13: Plant salt tolerance In W. W. Wallender & K. K. Tanji, (Eds.) Agricultural salinity assessment and management, ASCE manuals and reports on engineering practice (No. 71, 2nd ed.). American Society of Civil Engineers
Hill, R. W., Barker, J. B., & Lewis, C. S. (2011). Crop and wetland consumptive use and open water surface evaporation for Utah [Research report No. 213]. Utah Agricultural Experiment Station https://extension.usu.edu/irrigation/crop-water-use
Hoffman, G. J. & van Genucthen, M. T. (1983). Soil properties and efficient water use: W ater management for salinity control. In H. M Taylor, W. Jordan, & T. Sinclair (Eds.), Limitations to efficient water use in crop production. American Society of Agronomy.
Hoffman, G. J. & Shalhevet, J (2007). Chapter 7: Controlling salinity. In G. J. Hoffman, R. G. Evans, M. E. Jensen, D. L. Martin, & R. L. Elliot (Eds.), Design and operation of farm irrigation systems (2nd ed.). American Society of Agricultural and Biological Engineers.
Keren, R. & Miyamoto, S (2012). Chapter 21: Reclamation of saline, sodic, and boron-affected soils. In W. W. Wallender & K. K. Tanji (Eds.), Agricultural salinity assessment and management, ASCE manuals and reports on engineering practice (No. 71, 2nd ed.). American Society of Civil Engineers.
Letey, J., Hoffman, G. J., Hopmans, J. W., Grattan, S. R., Suarez, D., Corwin, D. L., Oster, J. D., Wu, L., & Amrhein, C. (2011) Evaluation of soil salinity leaching requirement guidelines Agricultural Water Management, 98(4), 502–506.
https://doi.org/10.1016/j.agwat.2010.08.009
Natural Resources Conservation Service. (2017). Conversion factors and tables. From Nutrient Management Module 7.
https://efotg.sc.egov.usda.gov/references/Delete/2017-121/Archived_Conversion_Factor_Tables_170118.pdf
O’Geen, A. (2015) Drought tip: Reclaiming saline, sodic, and saline-sodic soils [Publication 8519]. University of California Division of Agriculture and Natural Resources. https://anrcatalog.ucanr.edu/pdf/8519.pdf
Sagers, J., Waldron, B. L., Creech, J. E., Mott, I. W., & Bugbee, B. (2017). Salinity tolerance of three competing rangeland plant species: Studies in hydroponic culture. Ecology and Evolution, 7(24), 10916–10929. https://doi.org/10.1002/ece3.3607
Sonneveld, C., Baas, R., Nijssen, H. M. C., & de Hoog, J (1999). Salt tolerance of flower crops grown in soilless culture. Journal of Plant Nutrition, 22(6), 1033–1048. https://doi.org/10.1080/01904169909365692
Suarez, D. L. (2012) Chapter 11: Irrigation water quality assessments. In W. W. Wallender & K. K. Tanji, (Eds.), Agricultural salinity assessment and management. ASCE manuals and reports on engineering practice (No. 71, 2nd ed.). American Society of Civil Engineers.
In its programs and activities, including in admissions and employment, Utah State University does not discriminate or tolerate discrimination, including harassment, based on race, color, religion, sex, national origin, age, genetic information, sexual orientation, gender identity or expression, disability, status as a protected veteran, or any other status protected by University policy, Title IX, or any other federal, state, or local law. Utah State University is an equal opportunity employer and does not discriminate or tolerate discrimination including harassment in employment including in hiring, promotion, transfer, or termination based on race, color, religion, sex, national origin, age, genetic information, sexual orientation, gender identity or expression, disability, status as a protected veteran, or any other status protected by University policy or any other federal, state, or local law. Utah State University does not discriminate in its housing offerings and will treat all persons fairly and equally without regard to race, color, religion, sex, familial status, disability, national origin, source of income, sexual orientation, or gender identity. Additionally, the University endeavors to provide reasonable accommodations when necessary and to ensure equal access to qualified persons with disabilities. The following office has been designated to handle inquiries regarding the application of Title IX and its implementing regulations and/or USU’s non-discrimination policies: The Office of Equity in Distance Education, Room 400, Logan, Utah, titleix@usu.edu, 435-797-1266. For further information regarding non-discrimination, please visit equity.usu.edu, or contact: U.S. Department of Education, Office of Assistant Secretary for Civil Rights, 800-421-3481, ocr@ed.gov or U.S. Department of Education, Denver Regional Office, 303-844-5695 ocr.denver@ed.gov. Issued in furtherance of Cooperative Extension work, acts of May 8 and June 30, 1914, in cooperation with the U.S. Department of Agriculture, Kenneth L. White, Vice President for Extension and Agriculture, Utah State University.
August 2023
Utah State University Extension
Peer-Reviewed Article